Track major benchmarks and aim for outperformance.
(Updated December 31, 2022)
Delivering Diverse Asset Allocation and Optimizing Portfolio Construction
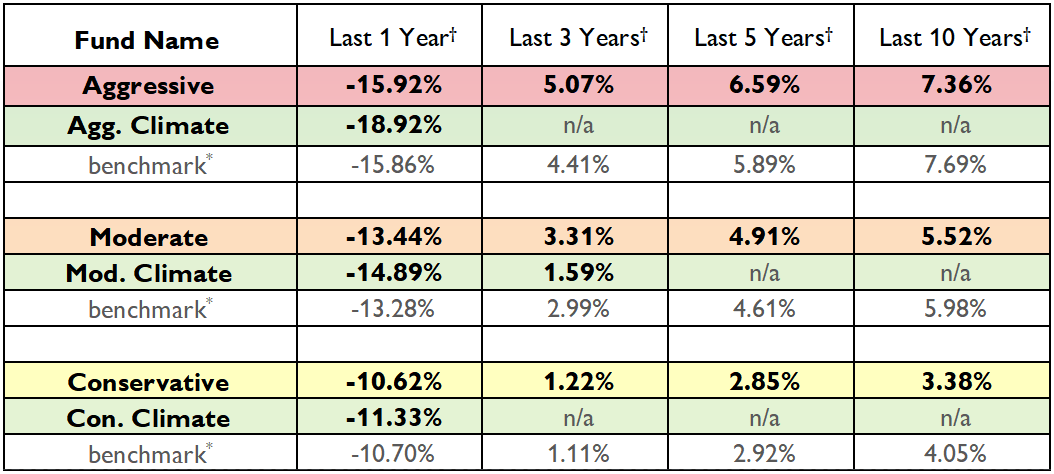
*”Benchmark” is a blend of benchmarks (see below and historical details on pages 4 & 5 here) for the fund’s underlying portfolios of stocks and fixed income, relative to the portfolio allocations within the fund’s model. †Percentages (1+ years) are annualized from 12/31/2022.
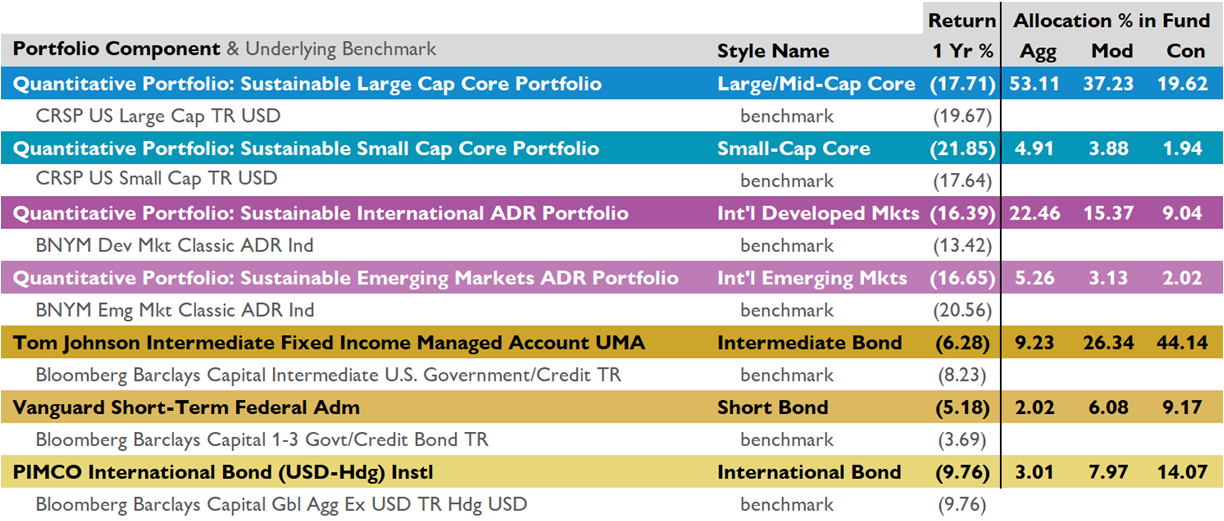
Performance by Fund Name is net of fees (top chart). Trailing 1 Year Performance by Portfolio Component is gross of fees (bottom chart). For the latest performance reports on all three funds, visit the Investment Performance Reports page.
Visit another page under Investment Overview:
Investment Overview Main Page
About the United Methodist Foundation
Value Comparison to Secular Advisors
Sustainable and Socially Responsible
Investment Partner & Services Provider